D3 can be used to build custom visualizations from scratch - using programming languages typically associated with web development. The problem is most data analysts aren’t web developers (myself included). Lack of even basic exposure to these frameworks can feel like a big hurdle. The aim of this article is to provide a basic starting point for anyone interested in learning D3.
Before we dive into it, why would anyone want to learn D3? There are great out-of-the-box visualization tools that do not require any programming - only simple drag and drop interfaces. These tools do suit the vast majority of use cases and I highly recommend using out-of-the-box visuals first. Here are some instances where learning a framework like D3 might be useful:
- Building custom visualizations: Have a custom visualization in mind that you haven’t been able to accomplish in your tool of choice? Many of the limitations are there for a reason. They abstract away low level concepts that allow analysts to work in a fast and consistent manner. The tool does most of the heavy lifting via drag and drop interfaces and low to no code. However, what are the possibilities that exist when you want to go beyond the tool?
- Possibly extending your favorite tool’s capabilities: Learning D3 and web programming fundamentals may be starting points to extend the capabilities of your favorite tool. For example, many of the Power BI custom visuals are built on top of D3.
- Purely for fun or enjoyment: Outside of your normal day job, you may want to explore new visuals that push the boundaries of what currently exist in enterprise tools. D3 is a great way to explore cutting edge techniques that may not yet be incorporated in standard toolsets.
More in-depth resources will be included at the end of this post - let’s get started with the basics!
HTML
Create the following file and save it to your local PC - name it index.html.
<!DOCTYPE html>
<html lang="en">
    <head>
        <title>Sample Chart</title>
        <meta charset="utf-8">
        <script src='https://d3js.org/d3.v5.min.js'></script>
    </head>
    <body>
		<h1>Sample Chart</h1>

        <!--Placeholder for d3 -->
        <div id="wrapper"></div>

        <!--Javascript code with our chart-->
        <script src="./chart.js"></script>
    </body>
</html>
The important parts here are as follows:
- The
<head>section: For now, just think of this as boilerplate code - webpage metadata and a reference to the D3 library. <h1>Sample Chart</h1>: This is a title above the chart. It’s not really necessary, but an example of including other HTML elements in your viz.<div id="wrapper"></div>: This is here as a wrapper for visual SVG elements we’ll add programattically.<script src="./chart.js"></script>: This points to a second file, where we’ll do most of the work - chart.js saved in the same directory.
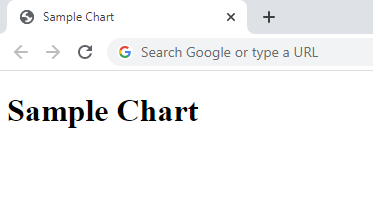
Open this file in your browser and you should see something like the following image.
Javascript and D3
Ok, the HTML part is done. Now create a javascript file, with the following starter code and save it to the same folder/directory on your PC - name it chart.js (notice this is the file we referenced in the HTML above).
async function renderMyChart() {
// D3 code in next step goes here
}
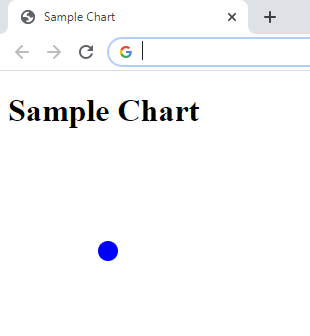
renderMyChart();Now is the time to reference that div element from the HTML (we gave it the ID of “wrapper”). We can do this by selecting the element in d3, and then “appending” an SVG. This will hold our chart elements. We give it a width of 200 pixels and height of 200 pixels (note, in practice this can be done dynamically based on screen size). We’ll also put a single circle in the middle of our svg with a radius of 10 and a blue fill.
// Add an svg to our html document (under the wrapper element)
const wrapper = d3.select('#wrapper')
    .append('svg')
        .attr('width', 200)
        .attr('height', 200);

// Place a blue circle in the middle of that svg (x coordinate of 100, y coordinate of 100)
wrapper
    .append('circle')
        .attr('cx', 100)
        .attr('cy', 100)
        .attr('r', 10)
        .attr('fill', 'blue');
After adding that code to the chart.js file (under the d3 code goes here comment), save your javascript file and reopen your index.html file in a browser. You should see something like the following image.
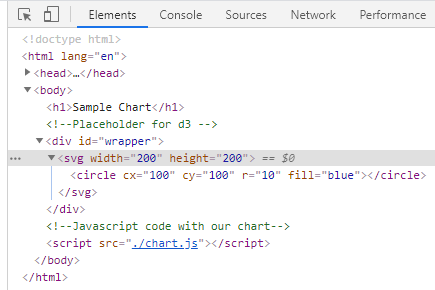
So what exactly did we do? The purprose of the javascript is manipulating the html output by adding, changing, and removing elements. We can show that d3 and the javascript code above manipulated our browser. You can see for yourself by right-clicking anywhere in the screen and choose “inspect” (for Chrome, other browsers may be different). This shows us the webpage that was rendered, and matches what we expected! The full code repo can be found here if you were following along with the example.
A More Comprehensive Example
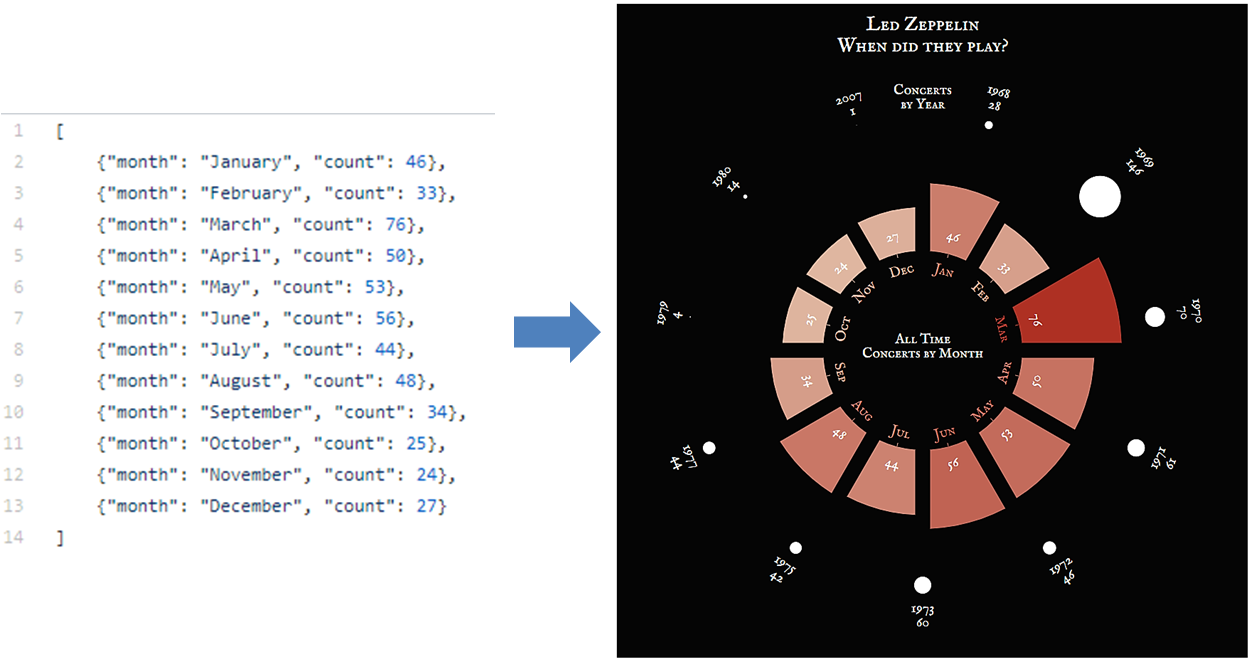
The principle of binding data to visual elements can be extended in whatever way the creative process takes you. You can also use it to replicate custom chart types or combine different visual elements in a new way. For an example of binding simple month and year counts to create a dual radial chart, visit my GitHub Repo. It contains the code and data used as an example of binding visual elements using the D3 library.
Recap
This was a purposefully simple example. Placing one blue circle in the middle of a webpage isn’t going to win any visualization awards. However, I often find that starting the learning process in a new technology is the hardest part. Now that you understand the fundamentals - you can go on to really digging in if this is something that interests you. Some resources to continue the journey:
- HTML, CSS, and Javascript: I found the W3 Schools intros simple and in bite-size chunks that were easy to get through.
- For some inspiration on what is possible, there are some great visualization designers that use D3. One of my favorites is Nadieh Bremer’s blog Visual Cinnamon.
I hope this was a helpful tutorial for those looking to get started with d3!