
What is Outlier Detection?
Detecting outliers can be important when exploring your data before building any type of machine learning model. Some causes of outliers include data collection issues, measurement errors, and data input errors. Detecting outliers is one step in analyzing data points for potential errors that may need to be removed prior to model training. This helps prevent a machine learning model from learning incorrect relationships and potentially lowering accuracy.
In this article, we will mock up a dataset from two distributions and see if we can detect the outliers.
Data Generation
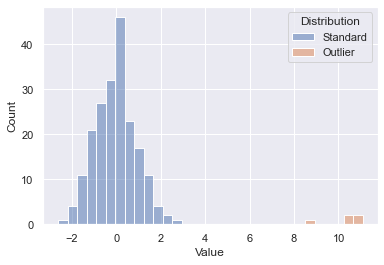
To test out the outlier detection model, a fictitious dataset from two samples was generated. Drawing 200 points at random from one distribution and 5 points at random from a separate shifted distribution gives us the below starting point. You’ll see the 200 initial points in blue and our outliers in orange. We know which is which since this was generated data, but on an unknown dataset the goal is to essentially spot the outliers without having that inside knowledge. Let’s see how well some out of the box scikit-learn algorithms can do.
Isolation Forest
One method of detecting outliers is using an Isolation Forest model from scikit-learn. This allows us to build a model that is similar to a random forest, but designed to detect outliers.
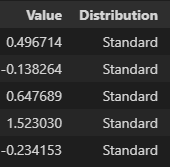
The pandas dataframe starting point after data generation is as follows - one column for the numerical values and a second ground truth that we can use for accuracy scoring:
Fit Model
The first step is to fit our model, note the fit method just takes in X as this is an unsupervised machine learning model.
# Fit
outlier_detector = IsolationForest(random_state=42)
outlier_detector.fit(df_combined.loc[:,['Value']])
Predict Outliers
Using the predict method, we can predict whether a value is an outlier or not (1 is not an outlier, closer to -1 is an outlier).
# Predict
prediction = outlier_detector.predict(df_combined.loc[:,['Value']])
prediction_strings = ['Outlier' if x < 0 else 'Standard' for x in prediction]
Review Results
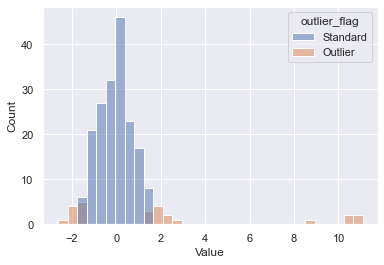
To review the results, we’ll both plot and calculate accuracy. Plotting our new prediction column on the original dataset yields the following. We can see that the outliers were picked up properly; however, some of the tails of our standard distribution were as well. We could further modify a contamination parameter to tune this to our dataset, but this is a great out of the box pass.
Accuracy, precision, and recall can also be simply calculated in this example. The model was 90% accurate as some of the data points from the initial dataset were incorrectly flagged as outliers.
# Calc ground truth counts
total_points = len(df_combined)
true_outliers = len(df_combined.loc[df_combined.Distribution == 'Outlier',:])
true_standard = total_points - true_outliers

# Calc predicted counts
true_positive_outliers = len(df_combined.loc[(df_combined.Distribution == 'Outlier') & (df_combined.outlier_flag == 'Outlier'),:])
false_negative_outliers = len(df_combined.loc[(df_combined.Distribution == 'Outlier') & (df_combined.outlier_flag != 'Outlier'),:])
false_positive_outliers = len(df_combined.loc[(df_combined.Distribution != 'Outlier') & (df_combined.outlier_flag == 'Outlier'),:])
true_negatitive_outliers = len(df_combined.loc[(df_combined.Distribution != 'Outlier') & (df_combined.outlier_flag != 'Outlier'),:])

# Display percentage results
accuracy = (true_positive_outliers + true_negatitive_outliers) / total_points
precision = true_positive_outliers / (true_positive_outliers + false_positive_outliers)
recall = true_positive_outliers / (true_positive_outliers + false_negative_outliers)

print(f'Accuracy {accuracy:.0%}, Precision {precision:.0%}, Recall {recall:.0%}')
Output:
Accuracy 90%
Precision 20%
Recall 100%Explain Rules
We can use decision tree classifiers to explain some of what is going on here.
clf = DecisionTreeClassifier(random_state=42, max_depth=2)
clf.fit(df_combined.loc[:,['Value']], df_combined.outlier_flag)
print(tree.export_text(clf, feature_names=['Value']))
|--- Value <= 1.57
| |--- Value <= -1.50
| | |--- class: Outlier
| |--- Value > -1.50
| | |--- class: Standard
|--- Value > 1.57
| |--- class: OutlierThe basic rules are keying off -1.5 and 1.57 as the range to determine “normal” and everything else is an outlier.
Elliptic Envelope
Isolation forests are not the only method for detecting outliers. Another that is suited for Gaussian distributed data is an Elliptic Envelope.
The code is essentially the same, we are just swapping out the model being used. Since our data was pulled from a random sample, this resulted in a slightly better fit.
Output:
Accuracy 92%
Precision 24%
Recall 100%
Summary
Different outlier detection models can be run on our data to automatically detect outliers. This can be a first step taken to analyze potential data issues that may negatively affect our modeling efforts.
All examples and files available on Github.