Coding a solution for SLICED - A live data science competition
Background
SLICED is a competitive data science game show - where participants are given 2 hours to explore and predict data they’ve just seen. Episodes are ongoing this summer and I highly recommend checking them out if you’re interested in data analytics, data science, or machine learning.
Nick Wan and Meg Risdal are the hosts of SLICED. For Week 1, contestants were challenged to predict board game ratings, given a list of features (year it was released, how long games take, etc).
You can check out the first episode here on Twitch, and learn more about the show and schedule here.
Data Science in 2 Hours
As a challenge, I wanted to also try to build a prediction in under two hours - similar to the contestants, albeit with much less pressure from not having 200 people watching me while I code. I have close to zero expertise in board games, besides childhood favorites (Risk, Stratego, Monopoly + the inevitable family squabbles), so it was interesting to see how accurate a prediction I could get.
Problem Overview
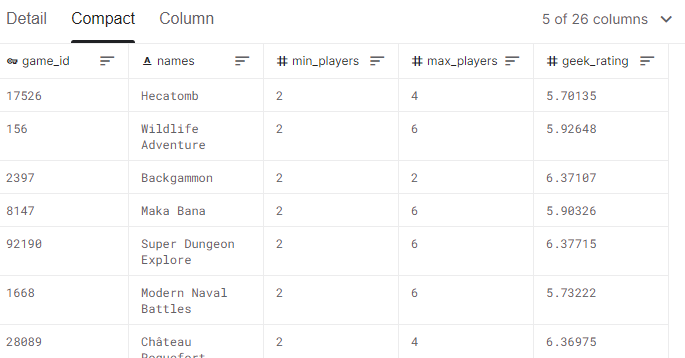
The dataset contains ~3,500 board games with various descriptive columns and “geek rating” that we are trying to predict. The goal is to predict the unknown geek rating for an additional 1,500 board games. You can see a sample of a few columns below, with the full data (and scoring) available on kaggle.
Exploratory Data Analysis
One of the first things I did (after importing libraries and data) was plot a pairgrid of various features with our target variable geek_rating. Some columns were text or a bit trickier to parse, which I saved for later steps. Doing this, I noticed a few interesting relationships:
- Characteristics of a board game (min players, max players, average play time) seem to have a loose relationship with predicting a rating. There’s probably a sweet spot in terms of how many players and how long a game takes for it to be rated well.
- There seems to be a stronger (and nonlinear) relationship between how many people own/vote on a game and how high it is rated.
- Games are around for some time before they are rated highly.
pg = sns.PairGrid(train_df, x_vars=['min_players', 'max_players', 'avg_time', 'year', 'owned', 'num_votes', 'age'], y_vars=['geek_rating'])
pg.map(sns.scatterplot)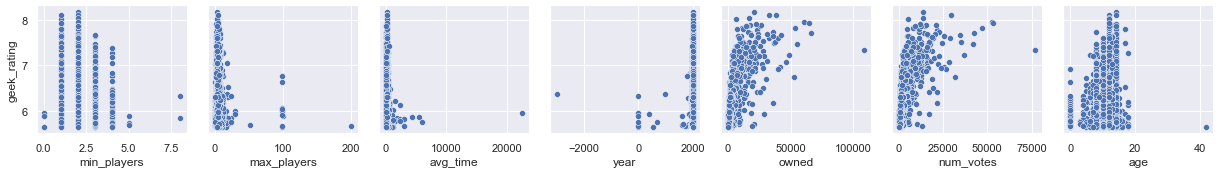
Digging into this a bit further, plotting the minimum number of players and rating, we see that a 1-2 player minimum scores the best on average. Similar analysis on the max players yields that the most “normal” game configurations that seem to be popular.
sns.boxplot(data=train_df, x='min_players', y='geek_rating')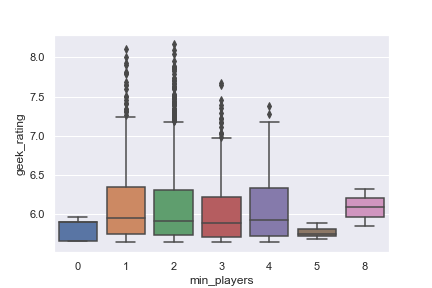
Visually scanning some of the game mechanics, I picked some key words that resulted in higher scores. A better method would be to parse out the various phrases and build a relationship using summary statistics between game mechanic and rating … but the two hours got away from me quickly!
train_df.groupby('mechanic')['geek_rating'].mean().sort_values(ascending=False)[:20]
train_df.groupby('mechanic')['geek_rating'].mean().sort_values(ascending=False)[-20:]
Feature Engineering
Player Grouping
I decided to add a “player grouping” feature, just to capture some of the relationships spotted visually in the number of players boxplot. A machine learning algorithm such as decision trees could pick this up automatically, but it was quick to code the information I thought was a useful as an aggregation to help the learning.
def player_grouping(df):
    # Categorize min and max player rollup
    if df['min_players'] <= 0:
        return 'Low'
    elif df['max_players'] <= 3:
        return 'Low'
    elif df['min_players'] == 8:
        return 'Exact'
    elif df['min_players'] == 5:
        return 'Odd'
    elif df['max_players'] > 3 and df['max_players'] <= 7:
        return 'Exact'
    else:
        return 'Other'

train_df['player_grouping'] = train_df.apply(lambda row: player_grouping(row), axis=1)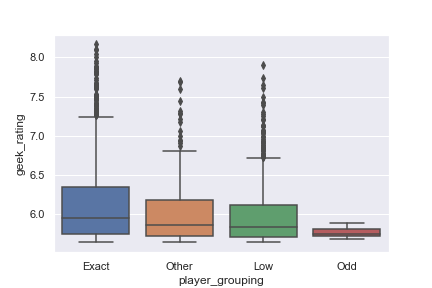
Category Scoring
The next feature I wanted to create was based on the category a game is listed as (Strategy, Dice, etc).
This information was stored in a number of columns. I created a lookup dictionary using the first one (better to have all 12, but time flies…) and then looped through the various columns to find the average score associated with the category terms. For example Medical, Renaissance, and Civilization categories did the best - and Trivia, Memory, and Number categories the worst.
category_lookup_dict = dict(train_df.groupby('category1')['geek_rating'].mean())

def get_combined_category_scoring(df, category_dict, col_list):
    # Loop through category columns and grab average scores.
    score_list = []
    for col in col_list:
        if df[col] != np.nan:
            # Handle errors for new categories not profiled
            try:
                score_list.append(category_dict[df[col]])
            except:
                pass
    if len(score_list) > 0:
        return np.mean(score_list)
    else:
        return 6.09 # avg for missing categories

col_list_cat = [col for col in train_df.columns if 'category' in col]
train_df['cat_score'] = train_df.apply(lambda row: get_combined_category_scoring(row, category_lookup_dict, col_list_cat), axis=1)
Mechanic Group
I did similar feature engineering with the game mechanic field, but less scientific about calculating the means and just a binary flag approach as time dwindled down.
Prediction
The final step was to choose the columns feed into the prediction and a machine learning algorithm. I tried a few and ended up with Gradient Boosting. I didn’t spend much time optimizing hyperparameters, and just went with the defaults.
# Identify feature and target columns
feature_cols = ['age', 'player_grouping', 'owned', 'num_votes', 'cat_score', 'min_players', 'max_players', 'avg_time',
       'min_time', 'max_time', 'year', 'mechanic_group']
target_col = 'geek_rating'

x = train_df[feature_cols]
y = train_df[target_col]

# Fit GBM and predcit results/accuracy metric (RMSE)
reg = GradientBoostingRegressor()
reg.fit(x, y)
predictions = reg.predict(x)
print(f'RMSE for training set: {np.sqrt(mean_squared_error(y_true=y, y_pred=predictions))}')
The root mean squared error was 0.141 for the training set and 0.167 for the validation set (30% of training samples).
Results
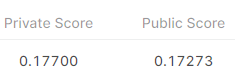
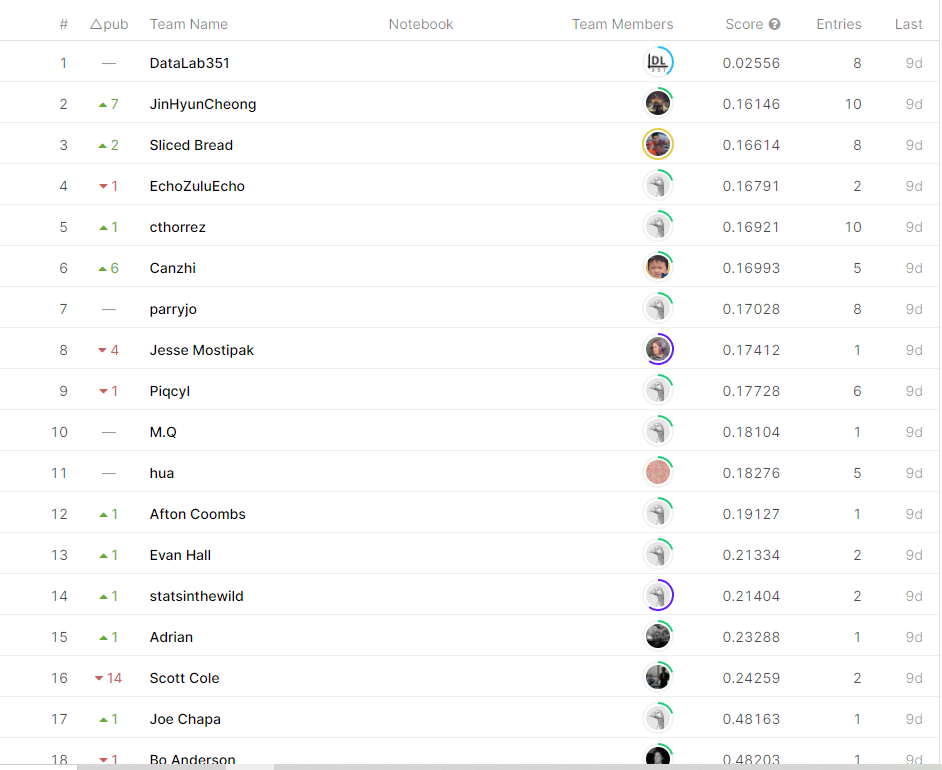
After incorporating these features and a couple iterations, I ended up with the following notebook and a result of 0.177 RMSE - around 9th on the leaderboard.
Summary
This was a fun challenge and recommend others try their hand at analyzing the data, and check out future episodes of SLICED to code along!
All examples and files available on Github.