
Time Series data does not always come perfectly clean. Some days may have gaps and missing values. Machine learning models may require no data gaps, and you will need to fill missing values as part of the data analysis and cleaning process. This article walks through how to identify and fill those gaps using the pandas resample method.
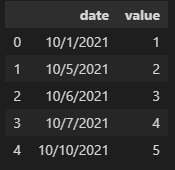
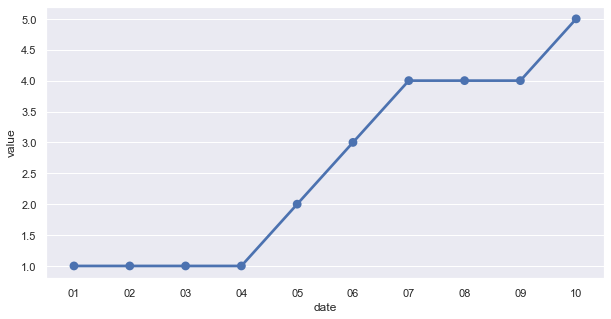
Original Data
For demonstration purposes, I mocked up some daily time series data (range of 10 days total) with some purposeful gaps. The initial data looks as follows:
Resample Method
One powerful time series function in pandas is resample function. This allows us to specify a rule for resampling a time series.
This resampling functionality is also useful for identifying and filling gaps in time series data - if we call resample on the same grain. For example, the original dataset we are working with has gaps and not every day has a value. Utilizing the resample function as follows will identify these gaps as NA values.
df.resample('1D').mean()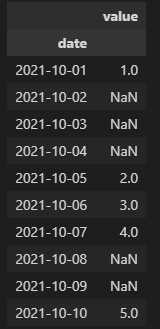
As you’ll see in the above, the resample method inserts NA values for days that did not exist. This expands our dataframe and essentially identifies the gaps to be handled. The next step is to fill these NA values with actual numbers based on a variety of methods.
Forward Fill Resample
One method for filling the missing values is a forward fill. With this approach, the value directly prior is used to fill the missing value. For example, the 2nd through 4th were missing in our data and will be filled with the value from the 1st (1.0).
df.resample('1D').mean().ffill()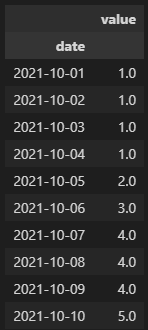
Backward Fill Resample
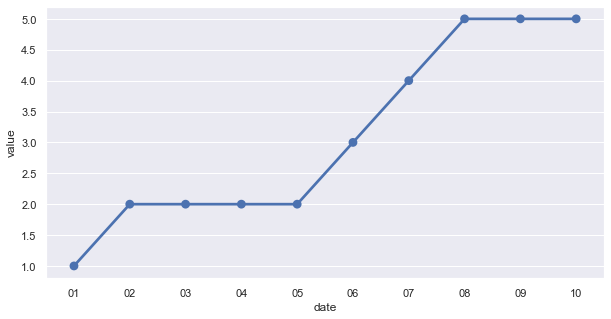
A similar method is the backward fill. After the above, you can probably guess what this does - uses the value after to fill missing data points. Instead of filling the 2nd through 4th with the 1.0 from the first day in our time series - you’ll see below that it now takes on the value of 2.0 (pulling from October 5th).
df.resample('1D').mean().bfill()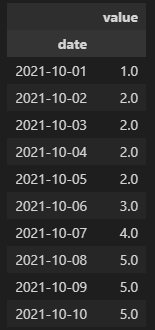
Interpolate Fill Resample
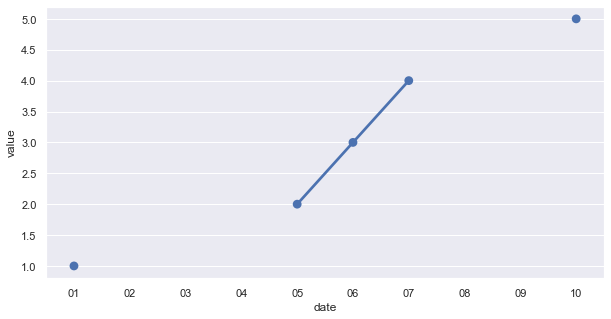
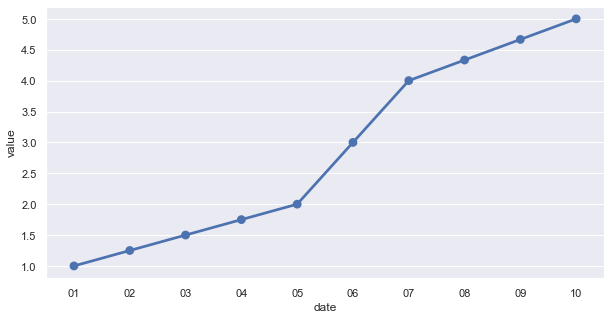
The final method in this article is the interpolate method. The below charts show interpolation, where data is essentially fitted from one point to the next. You’ll see in the below examples that smooth lines connect the missing values.
df.resample('1D').mean().interpolate()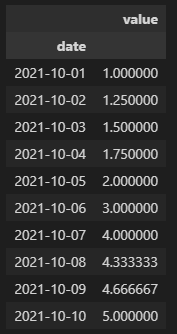
Summary
There are many ways to identify and fill gaps in time series data. The resample function is one easy way to identify and then fill missing data points. This can be used to prepare and clean data before building your machine learning model.
All examples and files available on Github.